Seeing the Invisible: How Malcolm Used AirTrack to Change His Runs

June 17, 2025
When Malcolm Buckley laces up his running shoes in London, he’s not just thinking about pace or distance—he’s thinking about air quality. A lifelong cyclist, runner, and data enthusiast with a PhD in physics, Malcolm discovered the AirTrack app when he joined AirTrack’s launch day challenge through the Sustainable Ventures community and ended up being the first challenge winner. What began as simple curiosity soon became a meaningful part of his routine.
“I hadn't come across anything like it before. AirTrack shows me what I’m actually breathing when I’m exercising. It gives me data specifically for the times when I am breathing the hardest, when I’m out on a run or cycling. It’s not just a number—it’s part of my routine now.”
From Curiosity to Commitment
Malcolm wasn’t looking for a personalised air quality tracker when he downloaded AirTrack - he just wanted to understand more. Living in London and spending a lot of time outdoors, he says “I was commuting for many years as a cyclist and a pedestrian in London and know the taste of the air quality”. He’d always assumed the air wasn’t great, but never had a clear picture of how it affected him personally.
“I kind of assumed air quality was bad, but I didn’t know how bad it was until I saw it. I just got curious to see what the data would say.”
Since then, checking the app has become a regular part of how he approaches his runs and rides every week.
Seeing the Data. Changing the Routine.
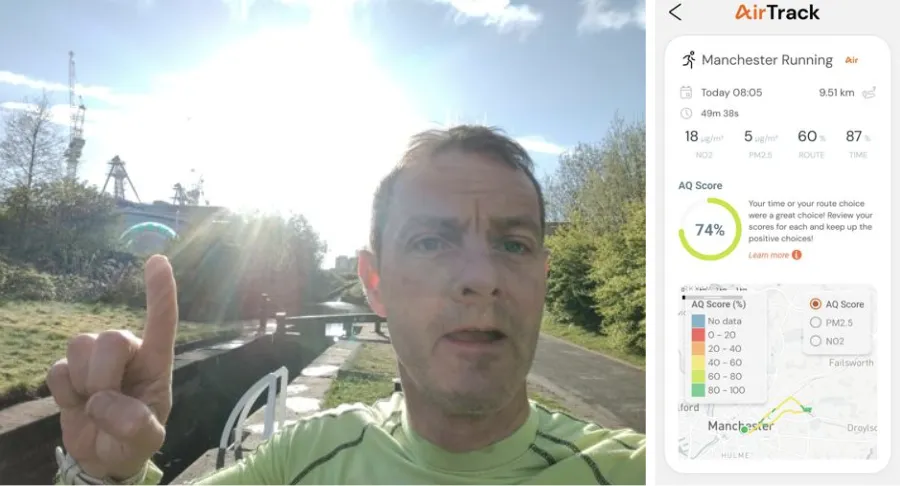
What stood out most to Malcolm was how specific and personal the data felt—tracking air exposure not just by location, but when he was breathing the hardest during a run or cycle.
“What I thought was really interesting was that it was breathing—like, when I’m actually running. Not just the background air quality, but what I’m actually breathing in.”
Run 1
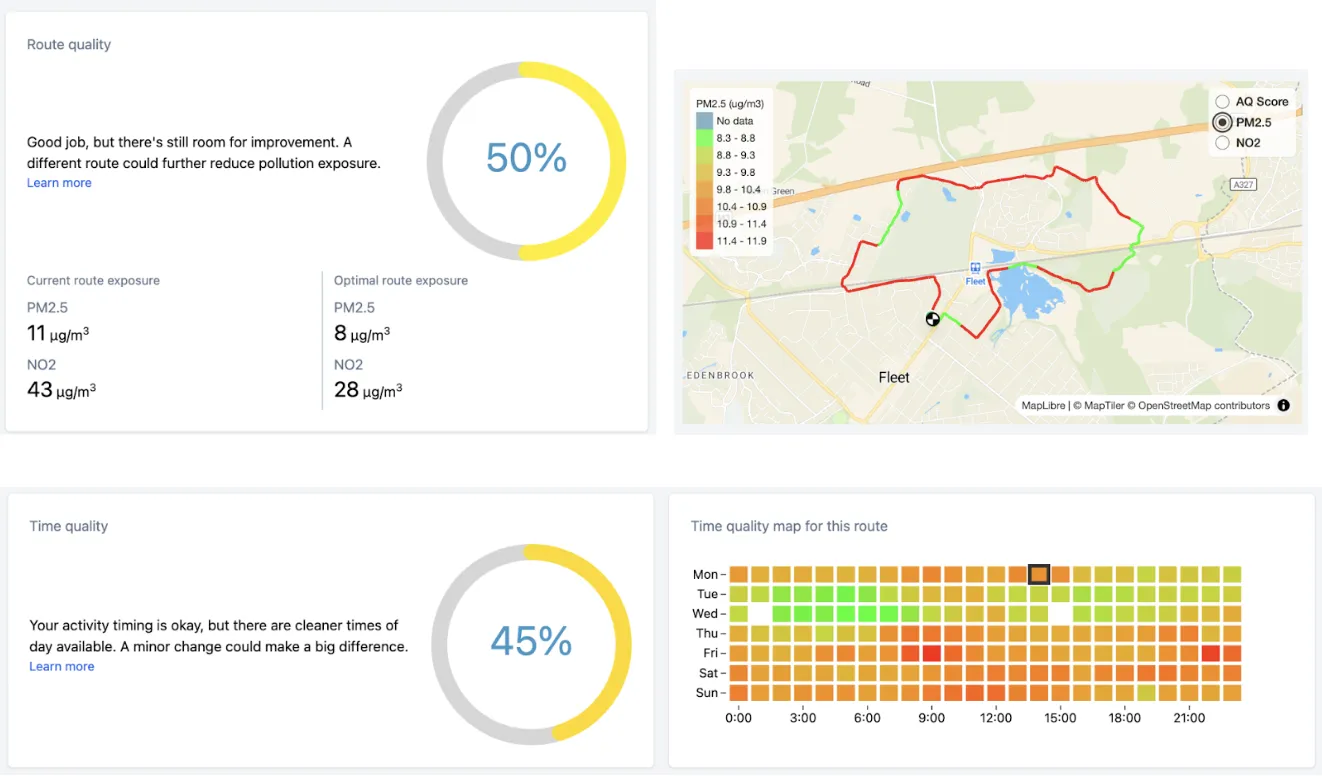
Malcolm began with a “baseline” run on one of his usual routes through fields, but it included a section parallel to the busy M3 motorway. That run scored just 50% Route Quality, with high levels of nitrogen dioxide (NO2) and particulate matter (PM2.5). The Time Quality score was also consistently low across (45%) the day.
Run 2
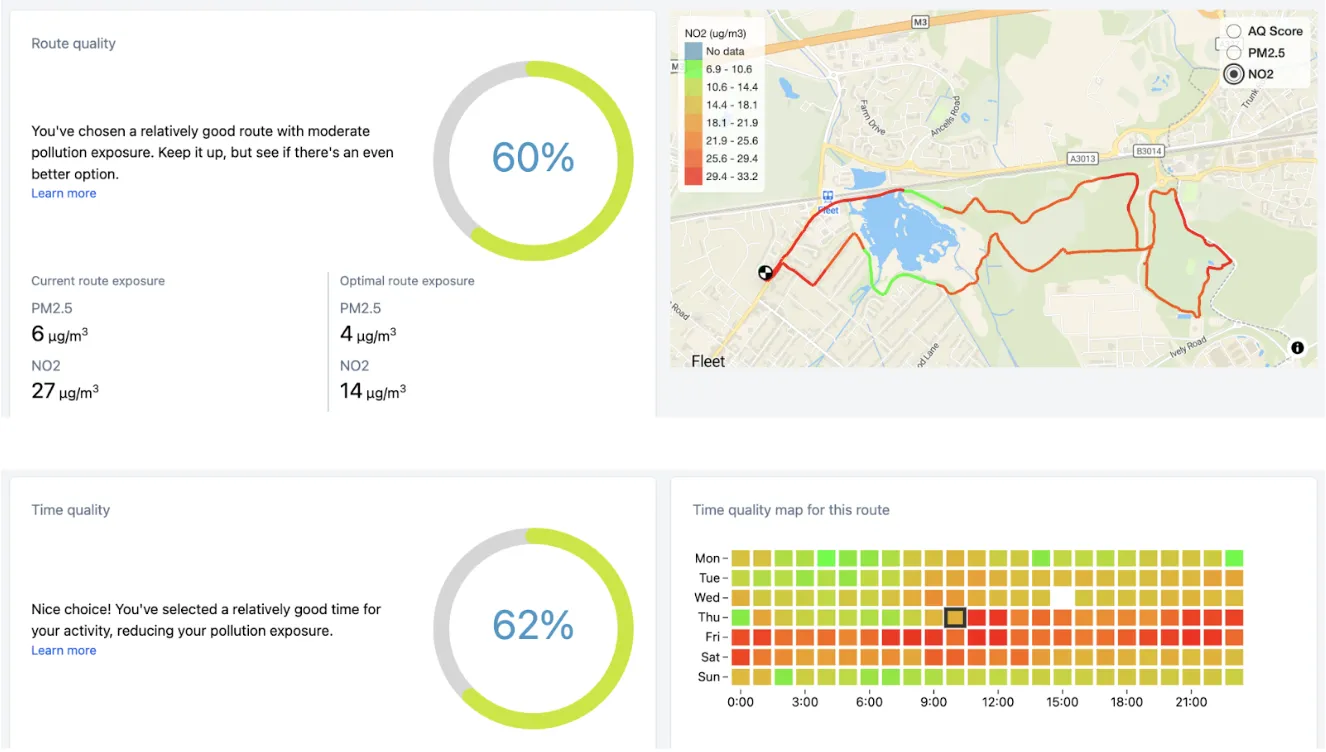
His first change was to cut out the stretch near the motorway and add in some quieter paths further south and east. This raised the Route Quality to 60% and improved both NO2 and PM2.5 exposure. He also saw more green and yellow on the weekly heatmap, showing cleaner conditions overall.
Run 3
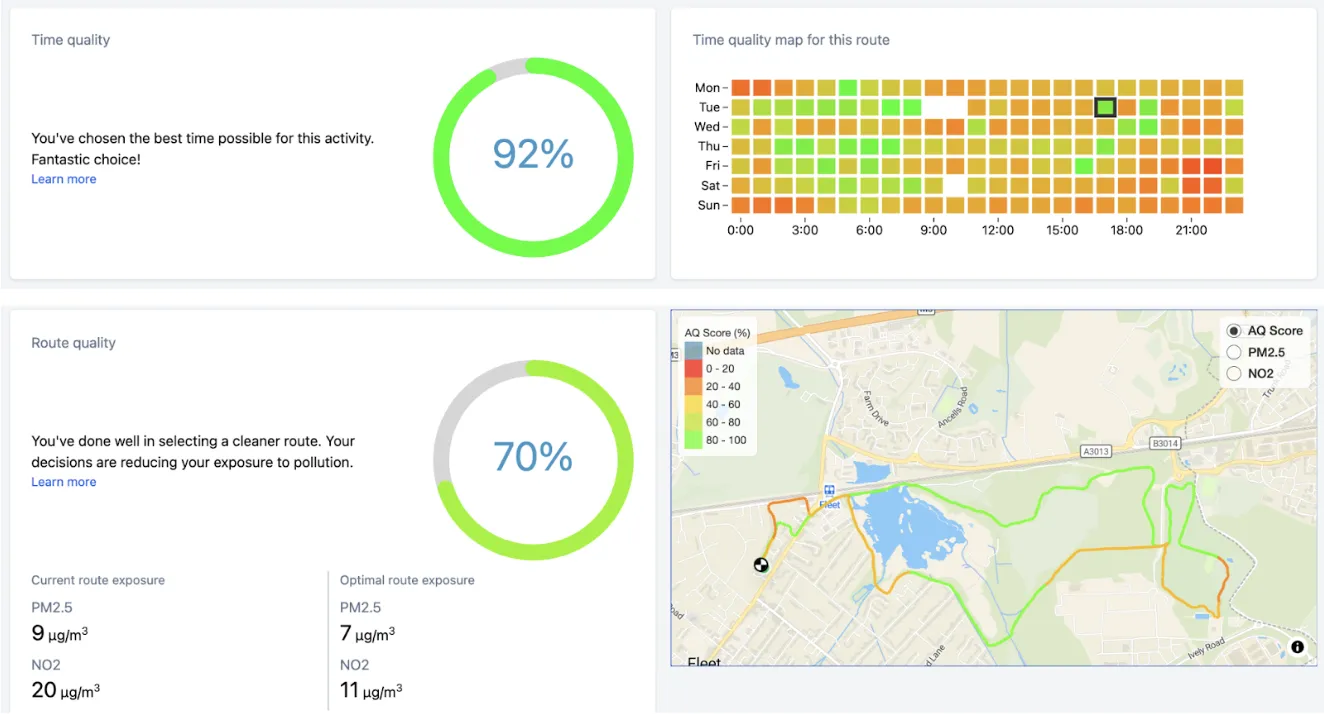
Next, he tried running the same improved route but at a different time of day. The result? An even better outcome.
“That got the Route Quality up to 70%, much better! There’s still some red around the residential roads, but it’s a lot less than before. PM2.5 is better too. And I absolutely nailed the Time Quality score!”
Sharing the Insights
Now, checking his Air Track data is as routine as checking pace or heart rate. While not everyone in his life shares his interest in data, it’s resonating with his more active friends.
“The people that are more active are more interested—because it’s when you're running or cycling that you’re breathing heavily. That’s when it matters most.”
He sees potential for run clubs to use AirTrack to reflect on exposure levels, even if their routes are fixed.
“Even with something like a park run, where the location is fixed, your journey to and from could vary a lot in air quality.”
When asked to describe AirTrack in three words?
“Lungfuls of data.”
Want to run like Malcolm?
Download AirTrack and discover what’s in the air when you’re breathing the hardest. You might be surprised how small shifts in your routine can have a big impact—on your exposure, your wellbeing, and your performance.
.svg)