Air pollution during the London Marathon: what the data shows

March 12, 2026

Road closures during the London Marathon reduce traffic and often improve air quality along the route, though effects vary by pollutant and location.
Each year, around 57,000 runners take to the streets for the London Marathon, passing through some of the city's busiest roads. But what happens to air pollution along the route when traffic stops?
To explore this, we analysed race-day air quality during the 2023 - 2025 London Marathons and compared it with typical Sundays. (Recent races have taken place in April, while earlier events were held in October.)
What we found
During marathon hours:
- 🚗 Traffic near the marathon route typically drops by around 40 - 50%.
- 🌫 Nitrogen dioxide (NO2) is often lower than on typical Sundays.
- 🌫 Particulate matter (PM10) is also often lower.
- 🌞 Ozone (O3) is sometimes slightly higher.
- 🌙 NO2 can increase again later in the day as roads reopen and traffic returns.
These patterns reflect how traffic emissions, atmospheric chemistry and weather conditions interact during large road closures.
Why pollution changes
Three main factors influence air pollution during the marathon.
1. Traffic drops along the route
Road closures significantly reduce traffic along the marathon course, with traffic volumes typically falling by around 40-50% compared with other Sundays.
Lower traffic reduces emissions of pollutants such as nitrogen oxides (NOx) from vehicle exhaust.
Traffic reductions also lower non-exhaust emissions, including:
- brake wear
- tyre and road wear
- resuspension
These sources can contribute to PM10, which is why the larger sized particles can also decrease near the route.
2. Air chemistry changes
When traffic emissions fall, there is less nitric oxide (NO) available to remove ozone through chemical reactions.
As a result, ozone levels can increase slightly, even while traffic-related pollutants decrease.
3. Weather and dispersion matter
Weather conditions also influence pollution levels during the marathon.
Wind, temperature and atmospheric mixing can affect how pollutants disperse, meaning air quality during each marathon can vary from year to year.
How air pollution changed during previous marathons
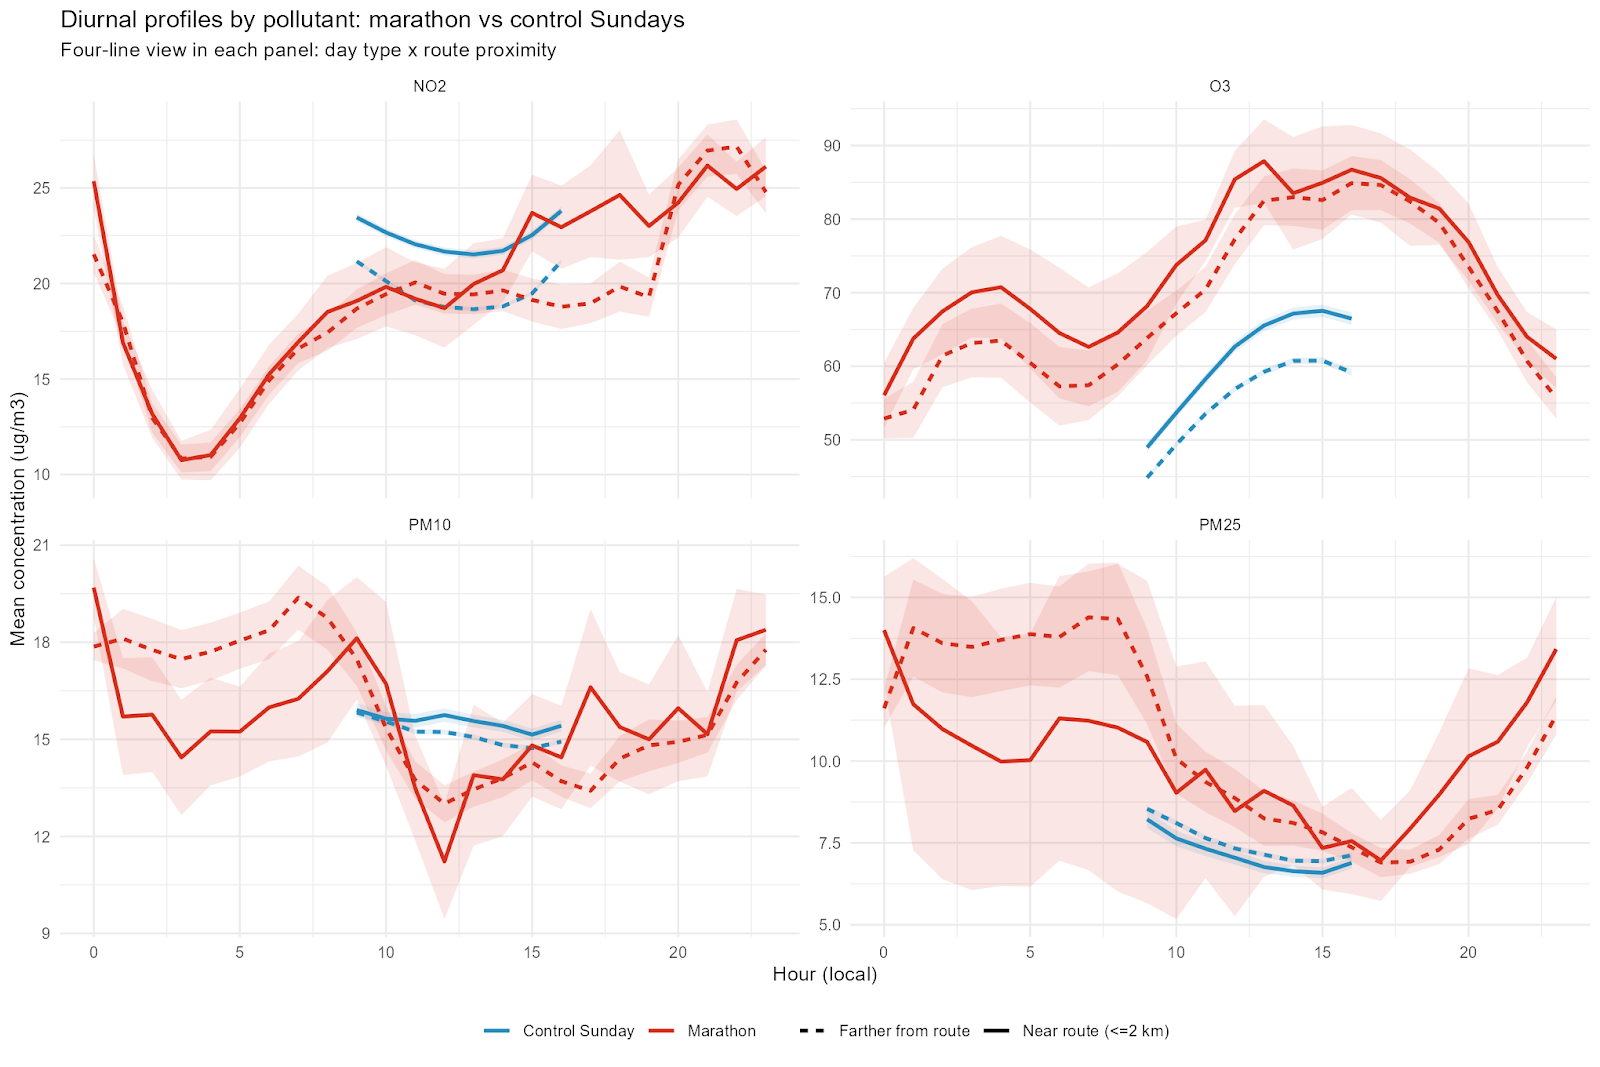
The chart below compares air pollution patterns on marathon days (red) with typical Sundays (blue).
Solid lines show locations near the marathon route, while dashed lines show locations farther away.
Each panel shows how pollution levels change throughout the day for different pollutants.
What we see:
- NO2: Often lower during the core marathon period when traffic is reduced, but levels can rise again later in the day as roads reopen.
- Ozone (O3): Typically higher during marathon hours, partly because lower traffic emissions reduce the chemical processes that normally remove ozone.
- PM10: Often dips around midday during the marathon. Reductions in traffic - including lower brake, tyre and road dust emissions - likely contribute to this pattern.
- Fine Particulate Matter (PM2.5): Shows more mixed patterns, with less consistent differences between marathon days and typical Sundays.
A closer look: roadside sites on the route
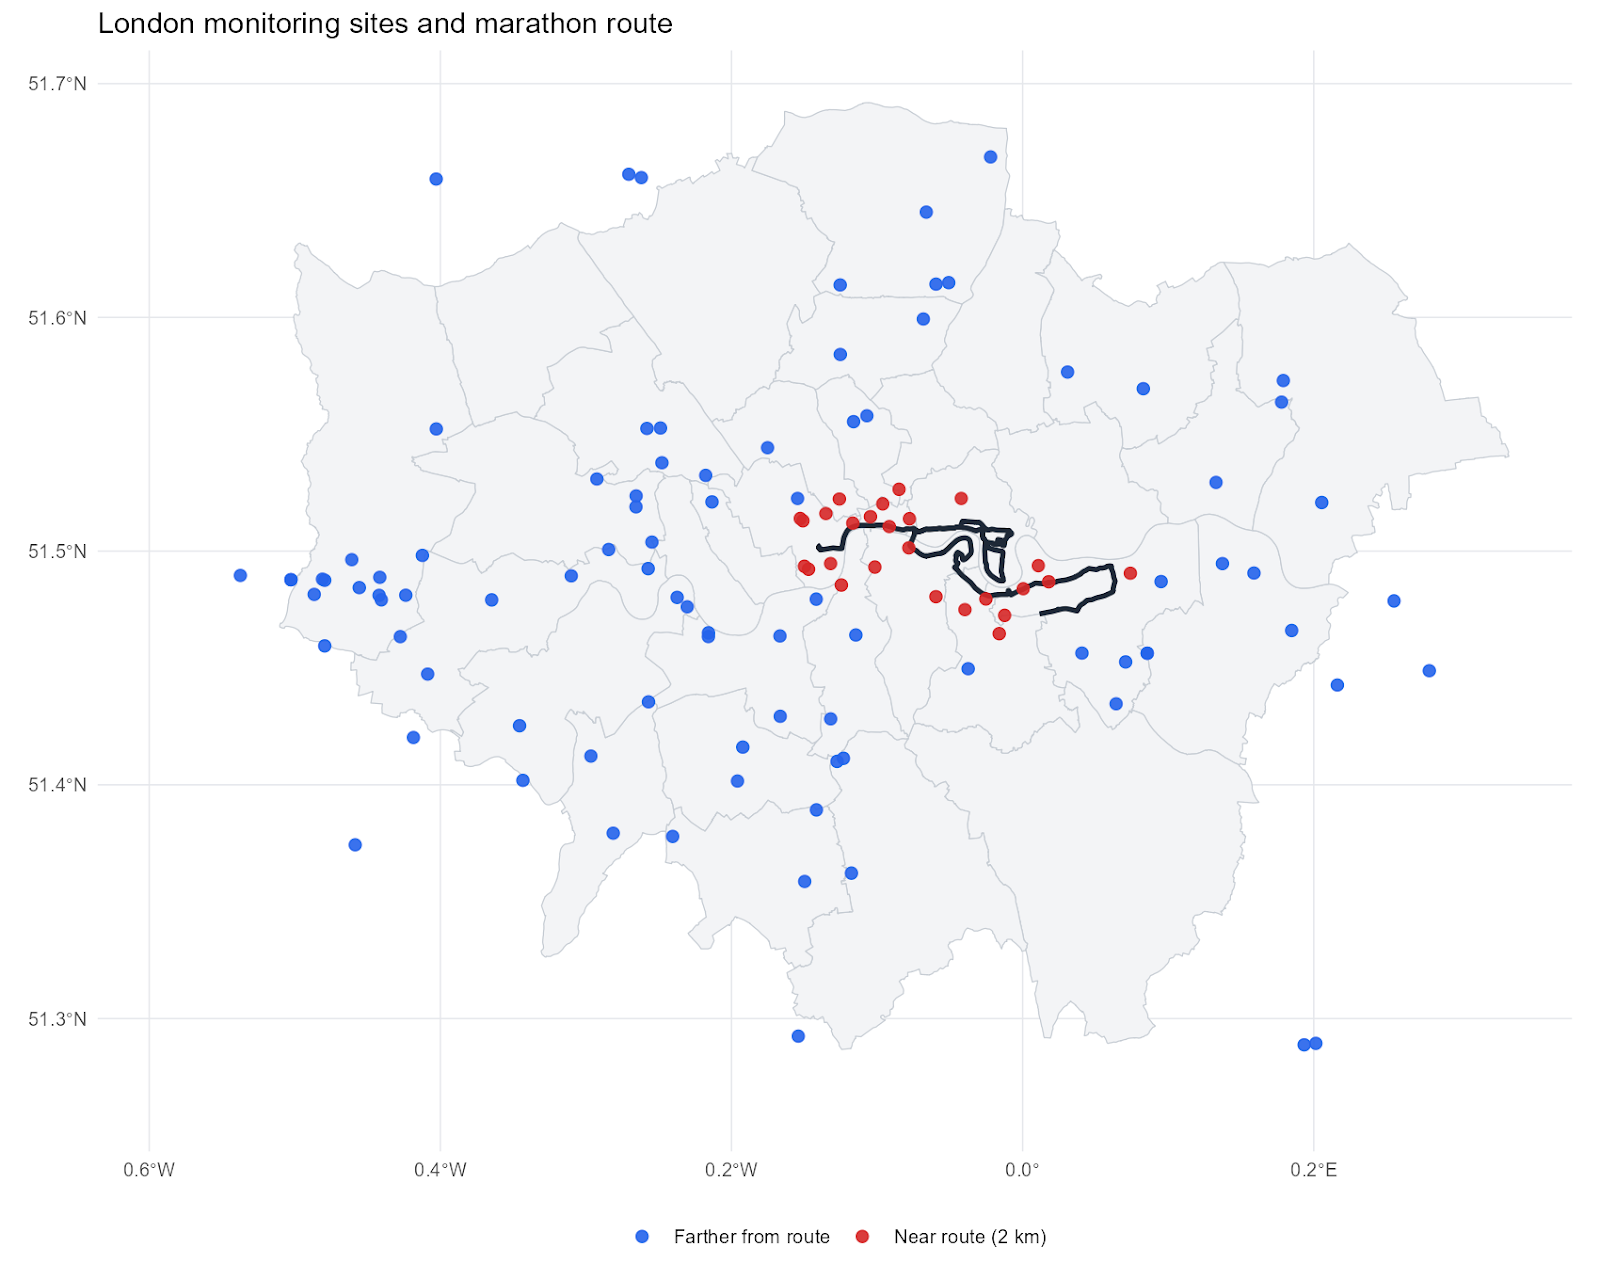
Some of the clearest evidence of the impact of road closures comes from air quality monitoring sites located directly on or close to the marathon route.
At Greenwich - Trafalgar Road (GN5), a monitoring station just 14 metres from the course, NO2 concentrations were around 77% lower than on comparable Sundays during the 2024 London Marathon.
Similarly, at Southwark - Tower Bridge Road (SK8), approximately 100 metres from the route, NO2 levels were 35–55% lower during the 2023 and 2024 races.
Earlier measurements from Upper Thames Street, a monitoring site on the City of London section of the course that is no longer operational, recorded an even larger 89% reduction in NO2 during the 2018 race. Larger reductions may have occurred because older vehicle fleets produced higher emissions than today’s cleaner fleet.
The scale of reductions can vary from year to year. For example, during the 2025 London Marathon, NO2 levels at Greenwich - Trafalgar Road were around 11% lower than comparable Sundays, likely reflecting differences in meteorological conditions.
Takeaway
Road closures and traffic reductions during the marathon are often linked to cleaner air for some traffic-related pollutants during race hours, particularly near the route.
However, the effects vary by pollutant, location, weather conditions and time of day. Indeed, while traffic reductions near the route were similar across years, overall pollutant concentrations were generally higher in 2025 than in 2023 - 2024.
It’s not the same everywhere. Air quality changes are largest close to the marathon route, where traffic reductions are greatest.
Although monitoring sites further from the route often show lower overall pollution levels, the difference between marathon days and typical Sundays is usually smaller.
Further away from the route:
- some traffic redistributes onto surrounding roads
- pollution changes tend to be smaller or more mixed.
Air quality during the London Marathon
We continue to analyse these phenomena using both measurement data and modelling. This helps show how factors such as road closures, traffic changes and weather influence air quality during the event.
Our analysis builds on patterns seen in previous races, where traffic reductions near the route often lead to lower nitrogen dioxide and particulate pollution during marathon hours, while ozone can increase due to atmospheric chemistry and weather conditions.
For runners and spectators this year who want a more personalised view, the AirTrack app provides individual air pollution exposure based on location and activity. This is relevant for both elite athletes and recreational runners - in fact, research suggests that inhaled doses of pollutants such as ozone and particulate matter may actually be higher for slower runners, because spending longer on the course can lead to greater cumulative exposure than elite athletes who finish in half the time.
In any case, being out on 26 April in London, running or wheeling, supporting athletes or just enjoying the atmosphere - enjoy the hopefully cleaner air!
Join us on our mission to personalise air quality for everyone.
.svg)