
How air quality could influence the 2026 World Cup

June 26, 2026
.webp)
The 2026 FIFA World Cup spans three host nations, 16 cities, and 104 matches. Scouts have analysed every squad. Coaches have dissected every formation. But there is one factor almost nobody is talking about, and it may be the most consequential environmental difference of the tournament. The air.
During a single 90 minute match, football players can run up to 13 kilometres, with heart rates frequently hitting 85–90% of maximum. At that intensity, a footballer's breathing rate is 10–20 times higher than at rest. Whatever pollutants are in the air, athletes inhale far more of them, and they do so during the moments when performance margins matter most.
The invisible opponent
Research shows that air quality above PM2.5 can reduce lung function, increase fatigue and hinder overall performance. A past analysis done by Air Aware Labs highlighted amongst people using AirTrack, football players are the most exposed to nitrogen dioxide (NO2). Athletes are particularly susceptible to air pollution as they are inhaling a significantly higher amount of air during strenuous activities. Therefore, understanding and mitigating air pollution exposure is critical to not only protect athlete health, but also to maintain overall performance and support long-term well being.
A study analysing 8,927 matches involving over 400 Bundesliga players across the 2017-2019 seasons found that increased exposure to air pollution particulate matter was linked with a reduction of high intensity efforts during matches. On average, Bundesliga players completed 26 to 34 passes per game with a 77% accuracy rate and 90% of the passes remaining under 30 meters. However, as the levels of PM10 levels increased, pass length also increased. Players tended to make longer passes to reduce physical strain and exertion. This underscores that air quality affects players not only through physical performance, but also by shaping physiological response and decision making during the match.
The WHO air quality guidelines reinforce that the annual average of nitrogen dioxide (NO2) should not exceed 10 µg/m³ while fine particulate matter (PM2.5) levels should remain under 5 µg/m³. It is also recommends daily PM2.5 exposure above 15 µg/m³ should occur no more than three days per year.
The 48 World Cup nations span from pristine air to pollution hotspots, highlighting the full spectrum of air quality. Training in cleaner air quality and then playing in a country with a higher PM2.5 level can significantly lower aerobic capacity, contribute to faster fatigue, and raise athletes’ heart rate. Conversely, training in worse air quality levels and then performing at cleaner levels can reduce respiratory stress, allow for a better oxygen uptake and give players a “clean air bonus” contributing to better physical endurance.
World Cup host cities ranked by air quality
We have analysed data from every AirTrack activity undertaken in the host cities over the past two years. Of these, Seattle leads with the cleanest air quality for PM2.5, yet still is not within the WHO annual guideline. On the other end of the spectrum, Mexico City is recorded to have 27 µg/m³ for PM2.5, alongside high NO2. This means athletes training and competing in the Mexican capital could be exposed to more than four times Seattle's PM2.5. Taking into account that pass accuracy decreases with increasing air pollution exposure, with the two of the Mexican host cities located at higher altitudes, this will further compound these effects.
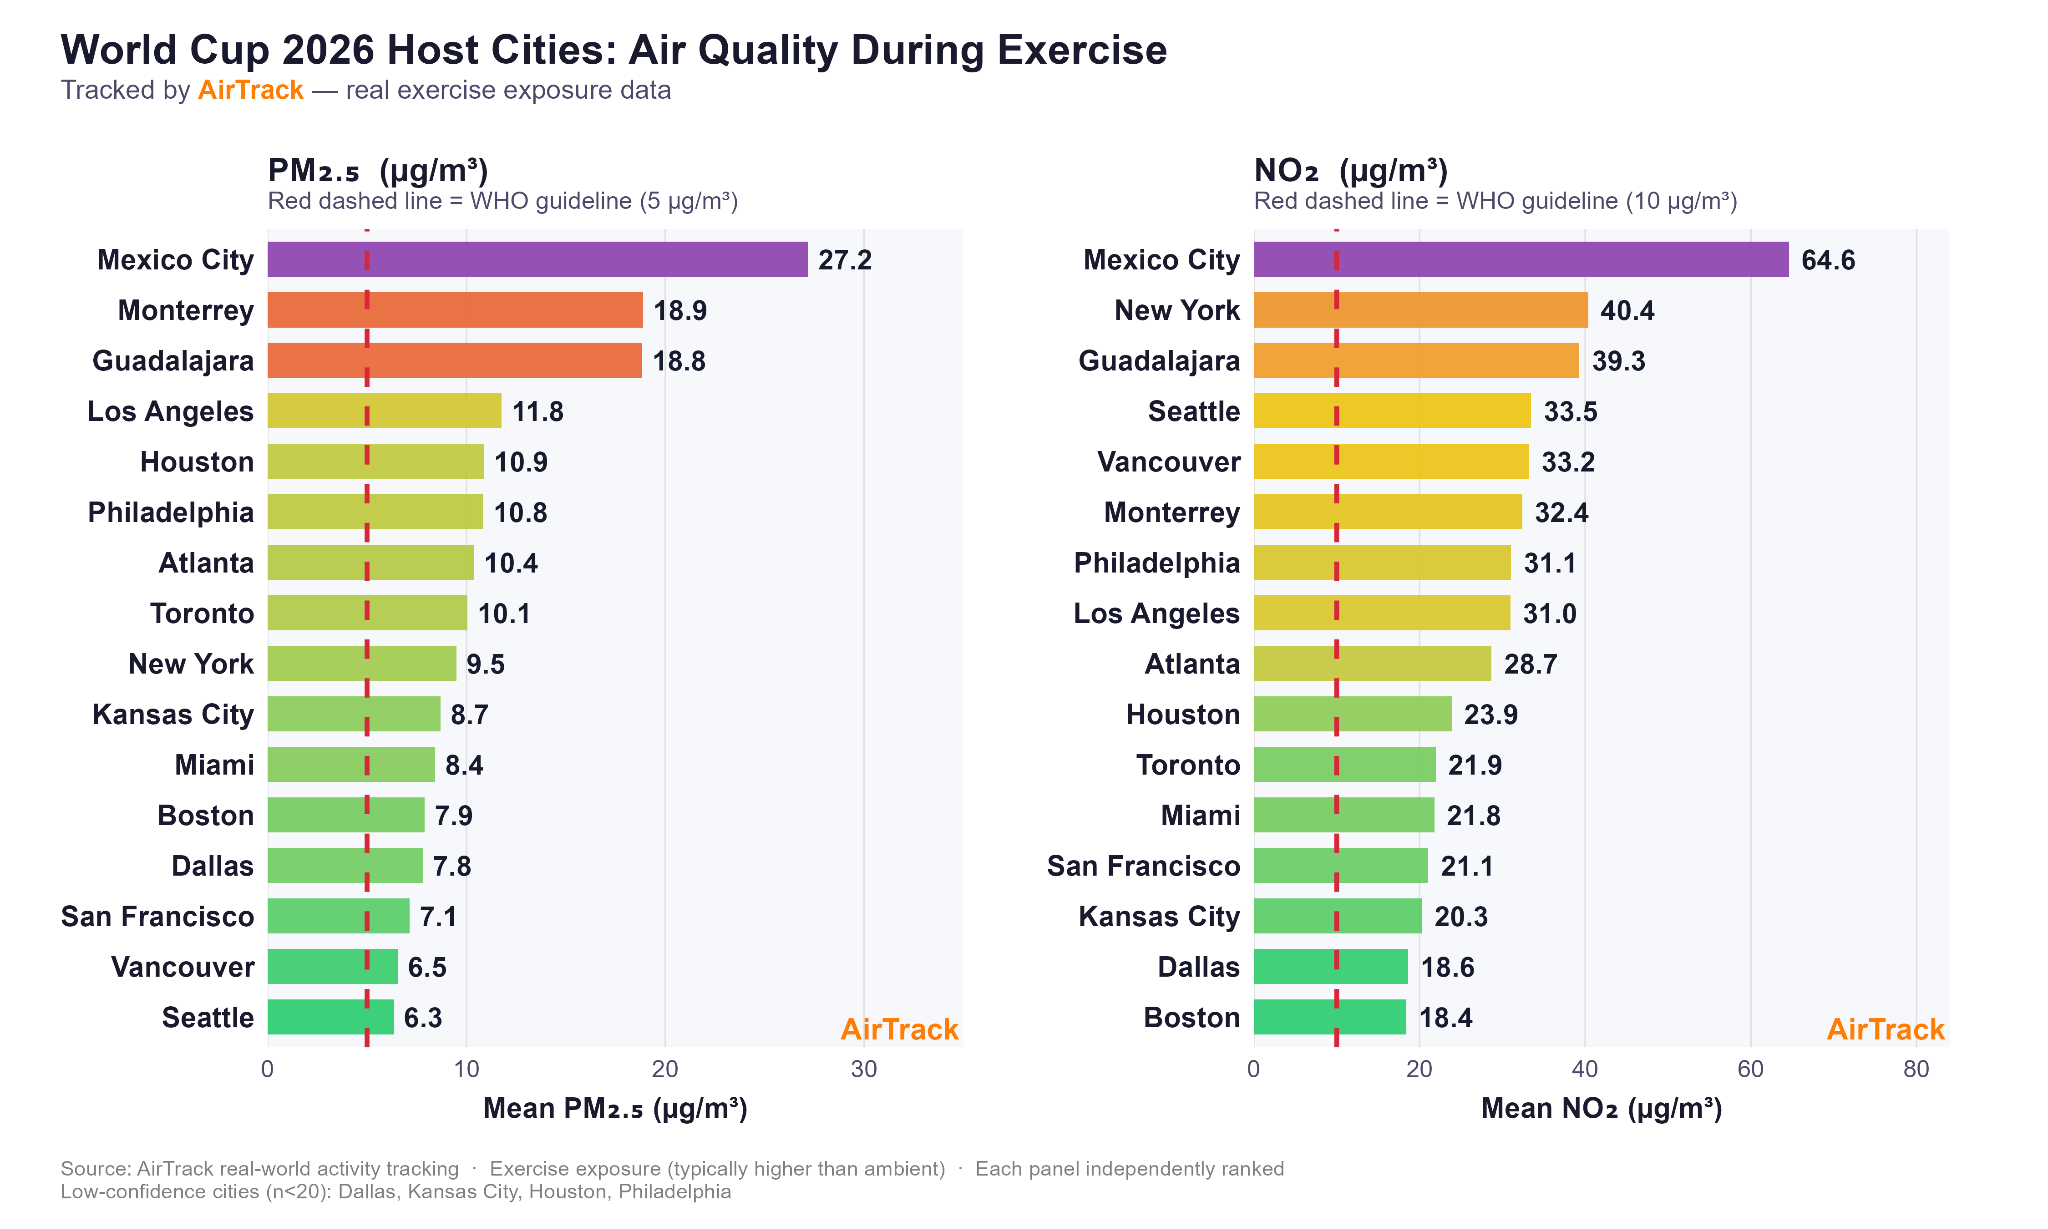
For NO2, the contrast is even clearer, with Mexico City recording levels well over three times higher than Boston, as the cleanest. New York, which was mid-ranked in PM2.5, was second worst on NO2 at 40 µg/m³, reflecting the density of its urban traffic. Notably, across the first 54 matches of the 2026 World Cup, analysis by Air Aware Labs found that players completed measurably fewer accurate passes on match days with higher nitrogen dioxide levels at the host stadium.
This variation means that the same team could play a match in the cleaner air of Seattle and within weeks play in Mexico City, requiring players to adapt quickly to a dramatically different environment. Preparation strategies, air quality awareness and recovery has therefore become an essential factor for protecting player welfare and performance.
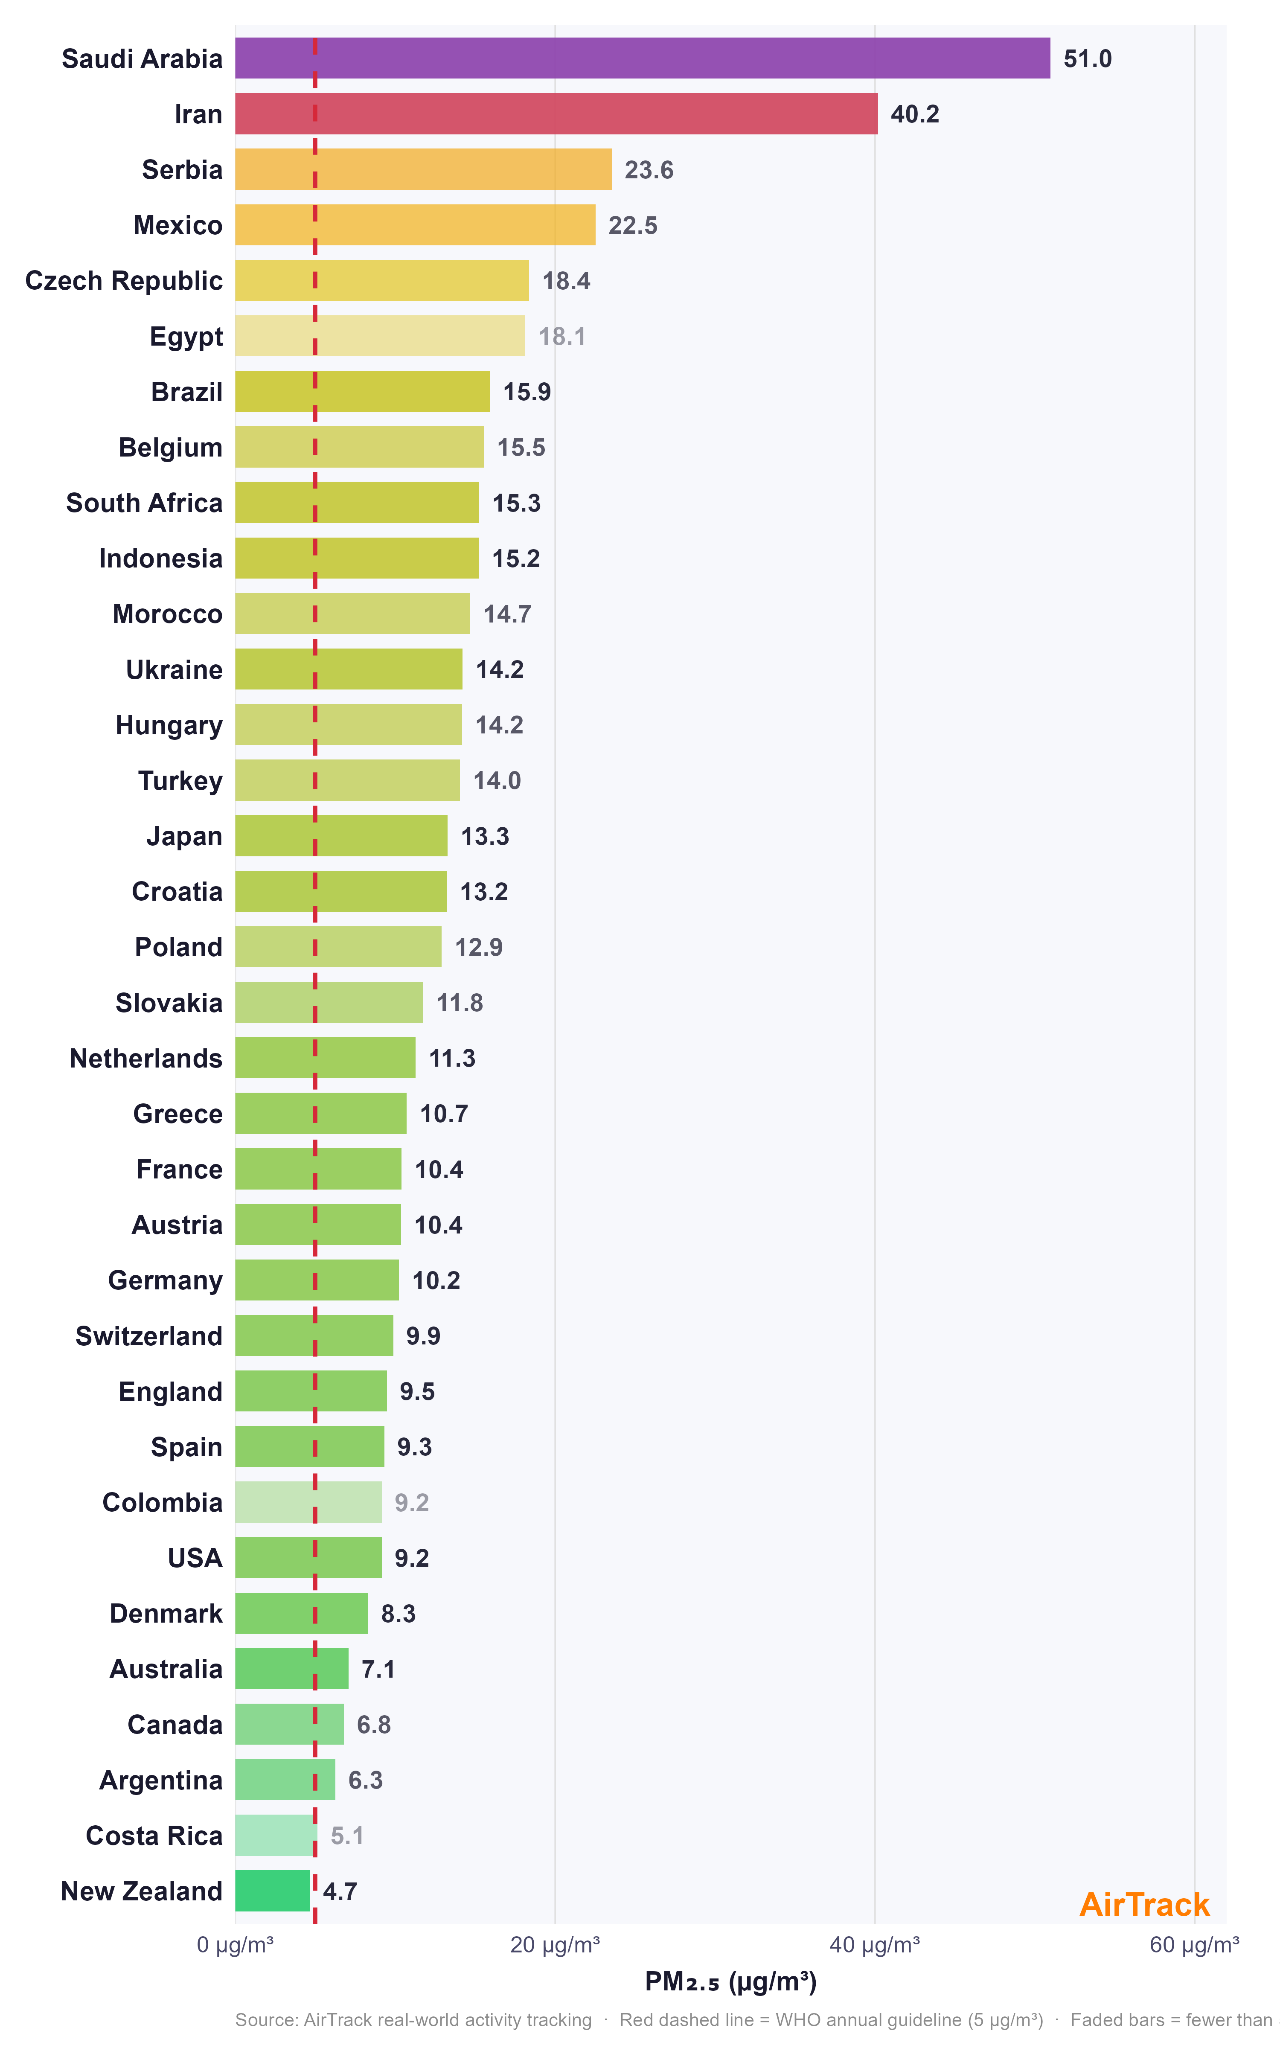
World Cup 2026: which countries have the cleanest air?
Meanwhile, back in their home environments, the 48 World Cup nations reflect the full air quality spectrum. We have analysed AirTrack data from these countries. At one extreme, Saudi Arabia records a mean PM2.5 at 51 µg/m³, which is over ten times greater than the annual WHO guideline. However, at the other end, New Zealand is the only participating country that is within the annual mean WHO guidelines on PM2.5. For teams like Saudi Arabia and Iran, competing in the cleanest venues in Canada and the US may give them a potential physiological bonus, contributing to better physical endurance.
What does this mean for the tournament?
For the first time in World Cup history, FIFA has implemented three-minute hydration breaks due to the extreme environmental conditions. However, there are no guidelines or responses to air quality levels. Although no match will be determined by heat and air quality alone, fine margins can accumulate, affecting performance when it matters most.
Discover more about how air quality changes can impact sports in the Navigating Air Quality in the World of Sports article.
Learn more about football players’ nitrogen dioxide exposure in Tracking Air Quality, One Workout at a Time article.
Explore more about how heat can affect air quality in the How temperature shapes the air we breathe article.
Read more about how air quality impacts overall football performance in the Air pollution and Football article.
Mia Simons overseen by Dr Will Hicks
.svg)


.png)


